User Quick Start Guide
SmartCMP mainly has two service scenarios, one is the cloud resource blueprint service scenario; the other is the ticket service scenario.
- Cloud resource blueprint service scenario The Cloud Resource Blueprint Service is based on blueprint modeling to define standard service frameworks and components, providing a rich set of out-of-the-box software components to visualize blueprints for automated deployment. For example, configuring a vSphere single-node virtual machine service is a typical scenario for a cloud resource blueprint service.
- Ticket service scenario The user applies for a service through the service catalog, and the service group receives and performs the ticket processing operation. There are two types of ticket services:
- Apply for non-standardized resources (for example, apply for a cloud resource blueprint service to uninstall a service deployment.)
- Services that require IT manual intervention (for example, manual ticket service for resetting passwords.)
「Note」For more guidance on cloud resource blueprint service and manual ticket service, please refer to:Cloud Resource Guidelines和Request Service
This chapter helps users get started with service request and self-service.
Service request: In the Service Catalog, you can use the quick request function, select the required blueprint, apply quickly, and automate the deployment.
Self-service operation: View detailed information about service deployment, instances or cloud resources in the Deployments menu, and perform self-service operation.
The next section will explain how to request service.
1. Log in
Enter SmartCMP IP in browser, such as: http://SmartCMP-Public-IP/#/login
and enter username & password
2. Request Service
After the service is successfully published, you can view and apply for the published service in service catalog.
Click Service Catalog, select the vSphere single-node service or OpenStack single-node service configured in the previous section, and click to enter the service request interface.
View the details of the service on this page, such as: organization information, deployment information, application parameters, etc.
Fill in/modify relevant information, if not enter the next step directly
Click Apply and the request is successful after approved by the process control (approval template) of the business group. Since Default business group has no approval process, service will be deployed directly after request.
3. Self-service Operation
After the service is requested, you can check the status of the deployment in Deployment - My Deployment.
If there is an approval process, you can go to “Requests” - “Pending Approval” to view the current approval process. Click on the service deployment request number to enter the approval details page of the blueprint deployment to view the current approval process.
If there is no approval process, click on the service deployment name to go to the deployment details page to view basic information, topology and operation history.
If the service has already started deployment, you can view the current deployment process in the operation history.
Go to "Deployment" - "My Deployment" - "Operation History", select the action to view the current deployment process below.
Or click the operation history in the upper right corner of the platform, click the operation you just applied to enter the operation history details page; or click “View All” to enter the operation history list interface, click the “operation name” of the service you just applied to enter the operation history details page to view the progress of the operation.
3.1. View Deployment Details and Self-Service Operation
After the service is successfully deployed, you can view the detailed information about the service deployment and the monitoring information of the instances and application components on the My Deployment page. A service deployment consists of one or more instances.
After selecting “Deployment” - “My Deployment”, you will see the service deployment list, which can be filtered by business group, stage (running, operation processing, shutdown, failed), state (normal, abnormal), owner or project in advanced search, or directly search operation.
In the service deployment list, you can select one or more service deployments to quickly perform some operations, including stop, installation SW, copy, extended expiration time, tear down, delete management information, change owner, change project, change business group and update Exts (example is vSphere service deployment and operation of different cloud platforms are different)
「Note」 Users can see the list of allowed operations after the deployment is generated only if the operating entitlement of the virtual machine is configured when tenant admin sets up the business group or the service is configured.
Default business group defaults all operations by the business group administrator and there is no approval process
Click on the name to view the details of the service deployment including "Basic Information", " Topology", "Operation History" and "Monitoring" (Monitoring of VMs and Application Components)
Basic Information: Includes name, business group, project, blueprint, resource bundle, cloud platform, and related information such as cost, status, and time. It also includes a list of input parameters for the service deployment and output result information. After the service deployment fails, some scenarios can be repaired offline. If the repair is successful, the service deployment status will be changed to "Running".
Topology: Includes blueprints, details, and process information for service deployment. Hovering over the service topology map will display the key information of the node. For example, the server node will display the instance name, guest operating system, IP address, memory, total disk space, number of vCPUs, CPU usage, memory usage, etc.
History: Shows the operation history of the service deployment
Monitoring: Shows monitoring information for instances and application components in the deployment.
3.2. View Deployment Details and Self-Service Operation
At the same time, instance status and details can be managed and operated in "Instances ". The enabling and approval of the operation needs to be set at the business group level or service configuration level.
Select “Deployments” - “Instances”, you will see a list of instances. In “Advanced Search”, you can filter by business group, state (started, lost, stopped), owner, project and tag. Click on "Show Columns" to select or not select certain columns for display.
In this list, you can select one or more instances to quickly perform some operations, including "Start", "Reboot", "Suspend", "Stop", "Run Script", "Set Tag", "Enable/Switch Monitoring". "Update Monitoring Agent", "Update Automation Agent", etc.
You can also click on an instance to enter its details interface for management and operation, including “Basic Information”, “History”, “Snapshot”, “Monitoring”, “Application List” tab and the top operation list.
「Note」Monitoring and tags may only be viewed if this instance is installed monitoring and applications and deployed successfully.
Basic Information:
Basic information about the virtual machine and its associated hosts, such as: name, operating system, installed software, vCPU, memory, status, SSH port, automation agent, monitoring mode, monitoring port, lease/retention expiration time, etc.
Relationships: server information, resource bundles, data storage, virtual machine storage policies, network labels, etc.
Physical host information
Users and groups
Organizational information: service deployment name, service name, business group, tenant, project, etc.
Operating status
IP address
Key-value labels
「Note」More host related information will be determined according to different cloud platforms and different service configuration items
History includes the operation history of the virtual machine
Snapshot displays the current snapshot information (snapshot name, creation time, etc.), and ”refresh”, “add”, “restore” and “delete” the snapshot
Monitoring includes monitoring data of the virtual machine CPU, memory, disk, and network (you can adjust the time span or average time to view historical monitoring data as needed)
「Note」Only after the instance configured with monitoring in VM templates is deployed successfully can data be seen in monitoring.
Application List displays the list of applications that are currently installed on the virtual machine (if the virtual machine does not have an application installed, the application list menu is not displayed)
Operation includes a list of operations that can be performed by the virtual machine. The specific operation introduction will be expanded later.
「Note」Users can see the list of allowed operations after the deployment is generated only if the operating entitlement of the virtual machine is configured when the business group is set or the service is configured. Default business group defaults all operations to the business group administrator and there is no approval process.
3.3. View Cloud Resource Details
In Resources, you can view and manage related cloud resource status and detail.
Select "Deployments" - " Resources", you will see the following categories: storage, container, network, PaaS and software.
Storage: Cloud Drive, Object Storage
Container: Deployment, Daemonset, StatefulSet, Container, Service, Ingress, PVC, ConfigMap and Secret.
Network: Load Balancer, LB Listener, LB Pool, LB SNAT Pool, Floating IP, Firewall, Security Group and DNS
PaaS: Relational Databases, Web App
Software: Software
3.4. Host Map
The host map can display the health status of the instance and container and display different colors according to the status of the performance indicator. If the instance or container is not configured for monitoring, it is grayed out by default. The darker the color, the more resources are used。
Move the mouse to the instance to display the instance name
Click to show detail:
Basic information: IP address, operating system, number of vCPUs, memory, total disk space
Organizational information: business groups, projects, owners
Performance monitoring metrics: memory usage, CPU usage, disk usage
「Note」Will not display performance monitoring indicators if monitoring is not installed.
Displayed content can be filtered according to your needs, such as all or installed monitoring or not installed monitoring, filtering by cloud platform, business group, project screening, label, etc.
4. Resource Recycling
Recycle bin
Recycle bin function to optimize the recycling process. Support for retrieving resources and data in the case of accidental deletion.
Specific steps:
In the left menu, select Deployment - Recycle Bin to manually delete the service deployment on the Recycle Bin list page and the resources are permanently released from the cloud platform.
Click “Restore” on the recycle bin list page to restore the resource.
Support setting resources to default retention time in the recycle bin and resources will be automatically deleted after expiration.
5. Two-factor Authentication
The platform supports enabling two-factor authentication for user login and operations. After two-factor authentication is enabled, an authentication step to verify dynamic information will be added to the original static password verification.
The administrator can set to enable two-factor authentication for user login and operations:
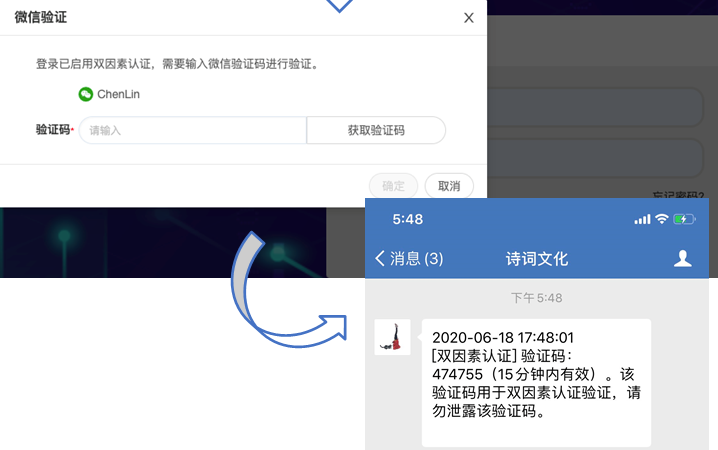
- When log-in is enabled with two-factor authentication, on the login interface, after the user enters a static password and clicks to log in, a pop-up box will prompt "Two-factor authentication is enabled, and verification code is required". The user can obtain the dynamic verification code through the configured authentication method to complete the two-factor authentication, as shown in the figure below.
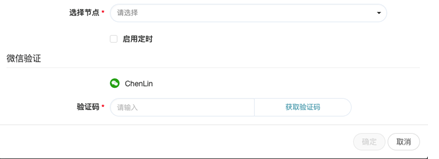
- When two-factor authentication is enabled for operations, taking the installation of software as an example, the user needs to click to obtain the verification code according to the prompts, and complete the two-factor authentication through the configured authentication method.