Monitoring & Alert
Alert provides the user with the virtual machine and any application self-service alert configuration.
In the left navigation, select "Monitoring & Alert". There are 5 secondary menus under the Monitoring & Alert, followed by "Alert Policy", "Alert Rules", "Triggered Alert", "Host Monitoring" and "Host Alerts".
1. Host Map
The host map can display the health status of the instance and container and display different colors according to the status of the performance indicator. If the instance or container is not configured for monitoring, it is grayed out by default. Light green to dark green to red, the darker the color, the more resources are used.
Move the mouse to the instance to display the instance name
Click to show details
Basic information: IP address, operating system, number of vCPUs, memory, total disk space
Organizational information: business groups, projects, owners
Performance monitoring metrics: memory usage, CPU usage, disk usage
「Note」Will not display performance monitoring indicators if monitoring is not installed.
- Displayed content can be filtered according to your needs, such as all or installed monitoring or not installed monitoring, filtering by cloud platform, business group, project screening, label, etc.
2. Component Monitoring
After the monitoring data is collected, a unified interface needs to be provided for display. SmartCMP can not only display the monitoring information on the deployment or cloud resource interface, but also display the monitoring information uniformly on a brand new page. As a separate page, component monitoring displays the monitoring of applications, instances, or virtual machines.
- For the specific steps of adding proxy components, please refer to:Component Library
- Click "Monitoring & Alerts"-"Component Monitoring" on the left navigation bar, the tree structure of the Export component is displayed on the left, and the related Exporter (used to describe all the components of the Exporter. Each component can define its own supported component types.) is displayed on the right.
- For example: Click on the NginxExporter displayed on the right to enter the "NginxExporter" tab, the left side of the page displays the NginxExporter related instance, and the right side displays the relevant description information of the NginxExporter component.
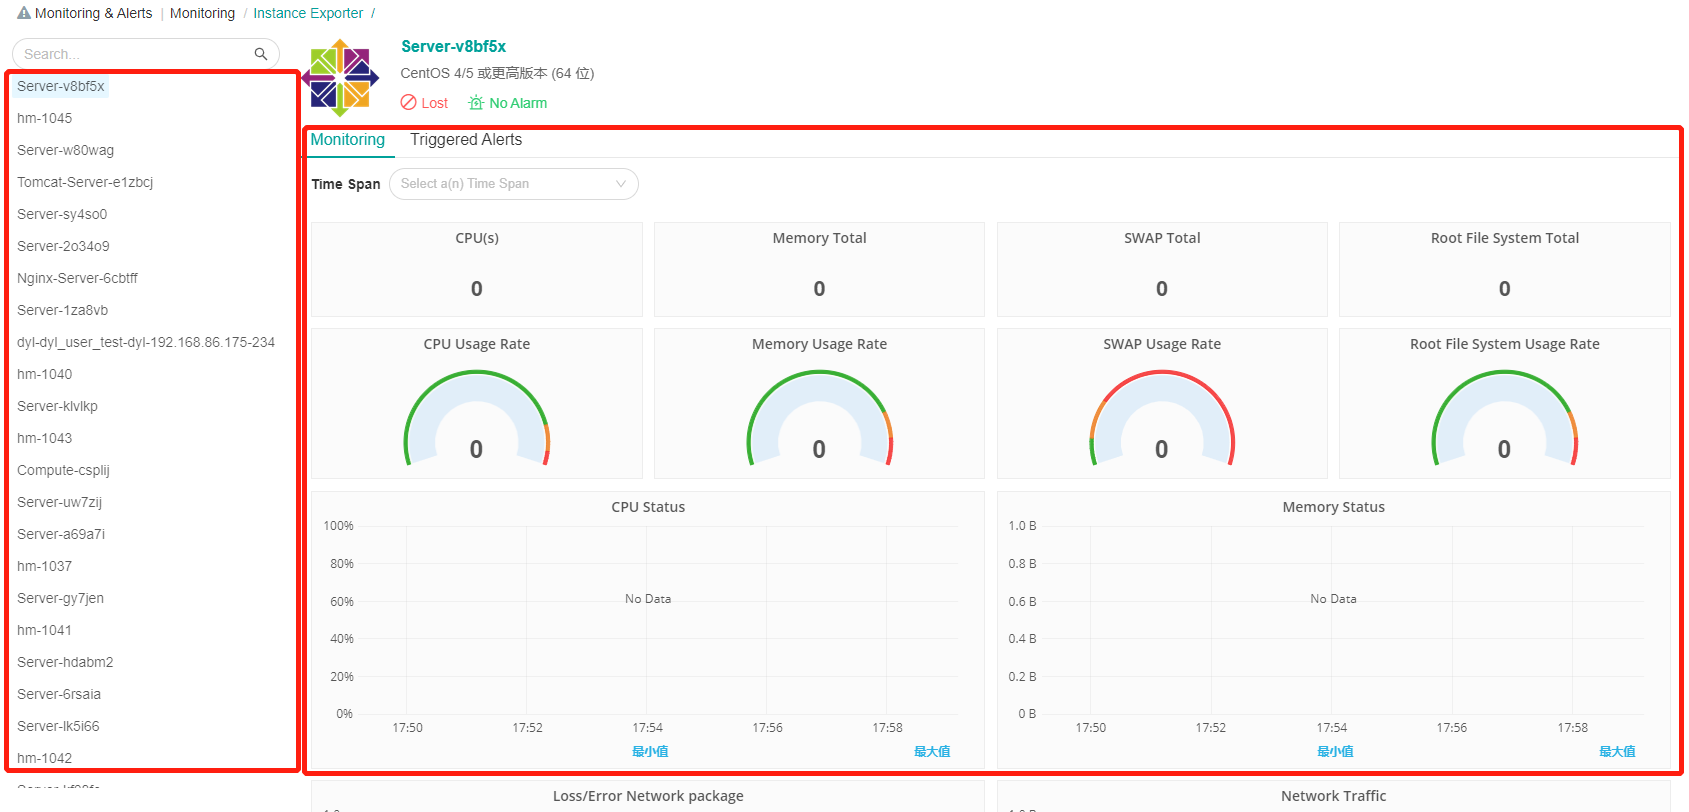
- Instance Exporter provides an abstract component for monitoring different VMs. No matter what kind of virtual machine is monitored, it will be listed in Instance Exporter. Go to the "Instance Exporter" tab, the virtual machine instance associated with the Instance Exporter is displayed on the left of the page, and the monitoring information of the virtual machine is displayed on the right.
「Note」 Component monitoring entitlement management: Every user can see the menu, but the scope of component resources that can be viewed is based on the user's configured entitlements in advance. For example, the tenant administrator sees the resources he owns and the business group administrator sees all resources in the business group he manages, etc.
3. Alert Policy
Used to define the conditions under which the selected object type (such as instance/application/container, etc.) triggers an alert. Click the second level menu "Alert Policy" under "Monitoring & Alerts" on the left navigation to display the alert policy list. The list includes the alert policy name, category, type (downtime, threshold or prediction), creation time, and creator. Users may add, edit, delete, etc. alert policies.
3.1.1. Add an Alert Policy
In the navigation tree on the left, choose Alert Policy, enter the alert policy list interface, and click Add to enter the alert policy interface.
On the Add Alert Policy page, define the basic information of the alert policy. Enter the name of the alert policy in turn and select the alert category and alert type. The alert category supports alerts for instances, applications, and containers. The alert type supports downtime alerts, threshold alerts, and predicted alerts for instances, threshold alerts and predicted alerts for applications, thresholds for containers, and predictive alerts.
Define the triggering conditions of the alert policy according to different alert types selected.
Downtime alert: Input time (minutes). After the instance loses response within the specified time, it will trigger the downtime alert.
Threshold alert: Select the maximum/minimum/average value of virtual machine/container’s indicator (such as memory usage (percentage), CPU usage (percentage), POD memory usage, etc.) in the past minutes/hours. If the value is less than / less than or equal to / greater than / greater than or equal to certain value, an alert will be triggered.
Predictive alert: Based on the value of the indicator in the past minutes / hours / days (such as memory usage (percentage), CPU usage (percentage), etc.), predict those in future time range (minutes / hours / days). If the value of the indicator is less than/less than or equal to / greater than / greater than or equal to certain value, an alert will be triggered.
- Click "Save". The alert policy is added successfully and the alert policy list interface will be displayed.
3.1.2. Edit an Alert Policy
Click "Alert Policy", select a line of added alert policy, the toolbar "Edit" button becomes available, click the "Edit" button, or directly click the alert policy name to enter the alert policy editing interface.
3.2. Delete an Alert Policy
Click "Alert Policy" to select an alert policy that has been added. The "Delete" button on the toolbar becomes available. Click the "Delete" button to confirm the deletion prompt, and the alert policy is deleted successfully.
4. Alert Rules
Used to define the scope to which the selected alert policy is applied and the notifications and actions that are triggered. Click the secondary menu "Alert Rules" under "Monitoring & Alerts" on the left navigation to display the alert rules list, including the alert name, alert level, alert policy name, range, object, status, creation time, creator, and so on. Alert rules can be added, edited, enabled, disabled, deleted, and so on.
4.1.1. Add an Alert Rules
Click "Alert Rules", enter the alert rules list interface, and click "Add".
Define basic information. Enter the name, select the alert policy, alert range, and alert level. After triggering xx times, it will automatically upgrade to a higher level. This supports alerts for business groups, projects, service deployments, and VMs. The alert object is based on the selected alert range and the alert level is warning and danger.
Define the user, role, or email address to be notified when the alert is triggered.
You can define the behavior after the alert is triggered. After triggering the behavior, you can set up to xx operations and stop the automatic execution.
Support instance expansion operations: shrink one node horizontally, scale one node horizontally, shut down, restart, expand 5G logical volume, increase 1G memory (vSphere), add 1 vCPU (vSphere), etc. Support for the expansion of the container: reduce the number of 3 copies, increase the number of 2 copies, etc.
- Click “Save” to return to the alert rules interface.
5. Triggered Alert
Click "Triggered Alerts" to display the list of triggered alerts, including name, target, type, first trigger time, last trigger time, and alert status. The alert status is divided into firing, muted, and resolved. It is also possible to recover, pause, and release the triggered alerts in the list.
Select a triggered alert. "Pause" and "Relieve" in the toolbar will become available. Click "Pause", there will be a prompt. After confirmation it will shows that the operation is successful.
Click on the alert name in the list to view the historical data. This page shows the object triggered the alert, the level of the alert, the triggered condition, the business group, the owner, the IP address, the alert chart (the adjustable time range help flexibly view the alert data for each time period), and the subsequent operation history of the alert.
Objects triggered alerts can be linked, such as service deployment link to service deployment monitoring page, instance link to instance monitoring page, application link to service deployment monitoring page.
6. Host Monitoring
On the Host Health page, users can see the health of the hosts in each platform in the current system. The running status of the host corresponds to three graphs: CPU usage (GHz), memory usage (GB), and storage usage (GB).
Users can set the time span to change the chart statistics. If there are multiple cloud platforms in the current system, users will see the labels of multiple cloud platforms. Clicking on different cloud platform tabs will jump to the data statistics page of the corresponding cloud platform, view the corresponding chart, and obtain the host information under the cloud platform.
7. Host Alerts
7.1.1. Subscribe to Host Alerts
Select “Monitor & Alert” - “Host Alerts” and click the “Subscribe” button to enter the subscription alert page.
In the subscription alert interface, select "Cloud Platform Management", "Monitoring Object", "Alert".
After the selection is complete, the alert details will be displayed. Click “General” to display the basic information of the alert. The interface information cannot be changed.
Click the Trigger tab to view the trigger
Click the “Operation” tab to set the alert rule operation. You can set the repeat operation frequency; click to add the alert operation, select the operation (warning or mail); select the number of warnings and warnings (none, one time or repeat).
Click “Save” to prompt the subscription to be successful.
7.1.2. Edit Host Alerts
Click "Host Alerts" to select a line of subscribed alerts. The toolbar "Edit" button becomes available. Click the "Edit" button, or directly click the alert name to enter the alert editing interface.
7.1.3. Refresh Alerts
Click "Host Alerts" to view the alert page. When the subscribed alert reaches the trigger condition of the alert, the alert is triggered. At this time, the small bell in the upper right corner will be prompted. Click to view the triggered alert information or click "Refresh". You can view the latest alert information.
7.1.4. Unsubscribe Alerts
Click "Host Alert", select a subscribed alert on the alert page, click the "Unsubscribe" button, and click "Yes" in the pop-up prompt to prompt the cancellation of the alert subscription.
8. Monitoring of Any Application
8.1. Cloud Resource Monitoring
Support monitoring for instances, application software and containers, and dynamically collect monitoring data in real time.
8.2. Instance Monitoring
If the monitoring agent has been added when the virtual machine template is configured, after the service deployment is successful, click “Deployments” - “My Deployments” in the left navigation bar to enter the service deployment list interface, click the service deployment name to enter the service deployment details interface.
Click the “Monitoring” tab and click the Instance Name tab to display the monitoring information of the instance under the deployment. If the deployment contains multiple instances, multiple tabs will appear, each tab corresponding to the monitoring of one instance. Adjust the time span to view monitoring information.
CPU, CPU usage, CPU status
Total memory, memory usage, memory status
SWAP total, SWAP usage
Root file system total, root file system usage
Lost/wrong network packets, network traffic
Disk throughput, disk IOPS
File system space usage
If no monitoring is added when configuring a VM template, you can add it after the deployment is successful. "Deployments" - "Instances", enter the instance list interface, select the instance, click "Enable/Switch Monitoring" at the top to add monitoring to the instance. After the addition is successful, it will be in "Deployments" - "Monitoring".
You can also click “Deployments” - “Instances” to enter the instance list interface, click the instance name to view the instance details page, click the “Monitoring” tab and click the instance name tab to display the instance monitoring information. Adjust the time span to view monitoring information.
8.3. Application Monitoring
Support application monitoring for JMX, MySQL, and Nginx. In the blueprint modeling, after the addition of the Exporter monitoring of the application is successful, and the blueprint with the application and monitoring is successfully deployed.
Click “Deployments” - “My Deployments” in the left navigation bar to enter the service deployment list interface.
Click the service deployment name to enter the service deployment details interface.
Click the “Monitoring” tab and click the App tab. This page will display the monitoring information of the application monitoring under the deployment.
8.4. Kubernetes Monitoring
Support Kubernetes monitoring alerts. Here’s the Kubernetes monitoring prerequisites:
Prometheus monitoring has been added to the Kubernetes cloud platform
In the "Infrastructure" - "Cloud Entries" - "Kubernetes", add the Prometheus monitoring address added in Kubernetes cloud platform: such as 192.xx.xx.xx:xxxx
After completing the above operations and deploying Kubernetes successfully,
Click "Deployments" - "Resources" - "Container Services" - "Deployment" to enter the container deployment list interface
Click the deployment name to enter the Kubernetes deployment details interface
3.Click the “Monitoring” tab to display the deployment monitoring information: Pods CPU usage (core), Pods memory usage, Pods network traffic, etc.